The problem with only looking at "today's revenue"
Many bike-sharing operators start off watching a single metric: how much they billed yesterday. It's like flying a plane looking only at the fuel gauge.
These are the 5 KPIs a good Fleet OS (like ours) should put on your screen every morning.
1. Utilisation rate per bike
What it measures: % of time each bike is in use vs available.
Why it matters: if you have 100 bikes and the average utilisation is 25%, you have too many bikes. If it's 70%, you're short of bikes and leaving money on the table.
Healthy benchmark: 35–55% in urban B2C operations; 60–80% in delivery.
2. Trips per active user (frequency)
What it measures: how many trips your average active user takes each week.
Why it matters: it indicates engagement. If it drops week after week, something is failing (price, coverage, bike quality).
Healthy benchmark: 2–4 trips/week in paid urban bike-sharing; 5–8 in B2B fleets with included usage.
3. Average incident response time
What it measures: minutes from a user reporting an incident to your team responding.
Why it matters: the factor most correlated with NPS. If you take more than 10 minutes to respond at peak time, you lose users.
Healthy benchmark: <5 minutes at peak, <30 minutes off-peak.
4. % of fleet operational at any given moment
What it measures: % of bikes in "OK" status vs in maintenance/broken down.
Why it matters: if your % drops below 85%, you have a serious operational problem. Users can't find available bikes even when there are some in the zone.
Healthy benchmark: 90–95% in well-run operations.
5. Month-on-month user churn
What it measures: % of users active in month N who are no longer active in month N+1.
Why it matters: the most leading indicator of problems. If your churn goes from 10% to 18%, something has broken in the experience and you'll feel it in revenue 2–3 months later.
Healthy benchmark: <12% monthly.
How Fleet OS delivers this
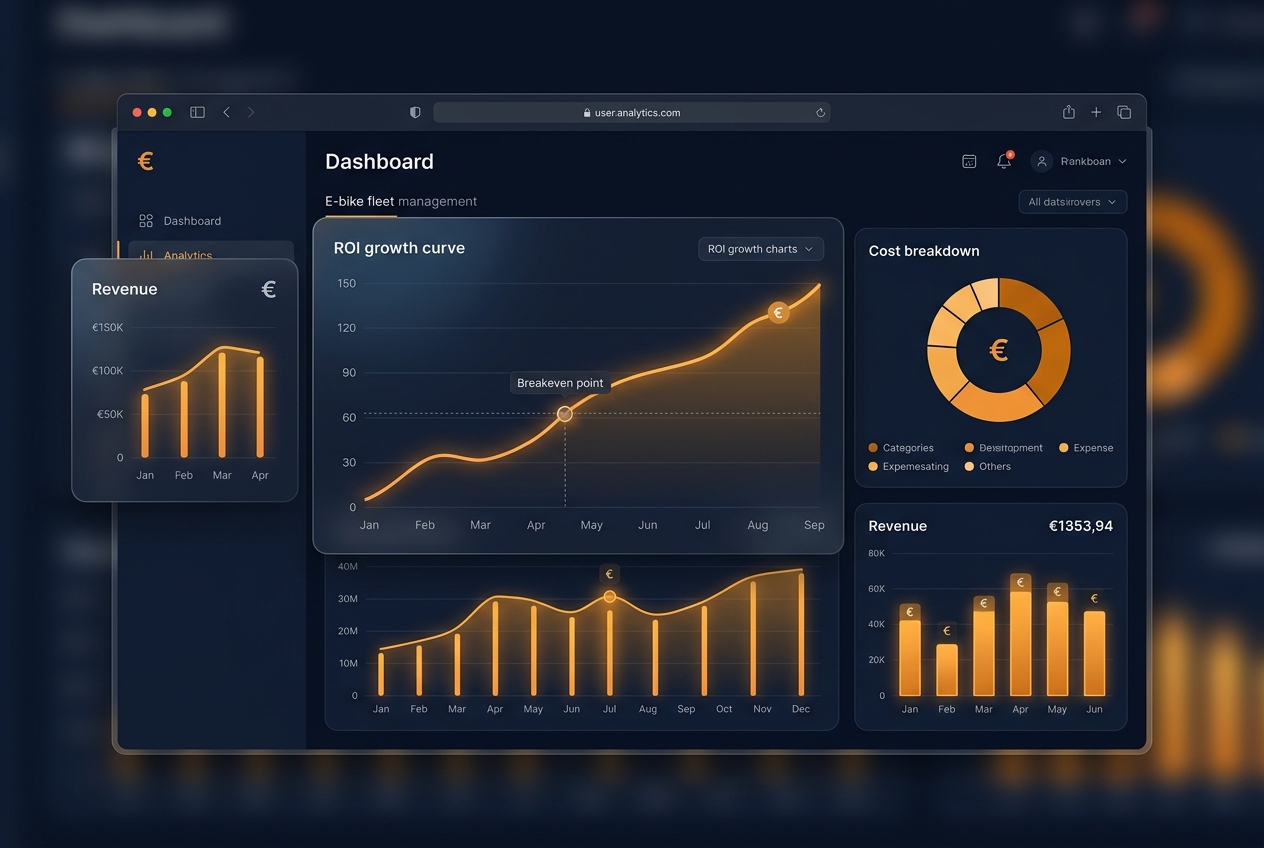
All the KPIs above are available on the Fleet OS dashboard by default:
- Real-time view (no overnight batch).
- Drill-down by city, zone and user type.
- Automatic alerts when a KPI falls outside the healthy range.
- Export to CSV/PDF for internal or investor reporting.
Conclusion
Operating bike-sharing without real-time KPIs is operating blind. These 5 are the minimum. Fleet OS ships them out of the box — along with 50+ additional metrics serious operators need.
Want to see a Fleet OS demo? Talk to sales.
NEXT STEP
Want a tailored proposal for your operation?
Tell us what you need and we'll get back to you within 24 hours with a plan adapted to your business.
Talk to sales