Puntos clave
- Una flota de 50 e-bikes cuesta ≈4.200 €/mes operarla todo incluido (SaaS, amortización, mantenimiento, operación de campo y seguro).
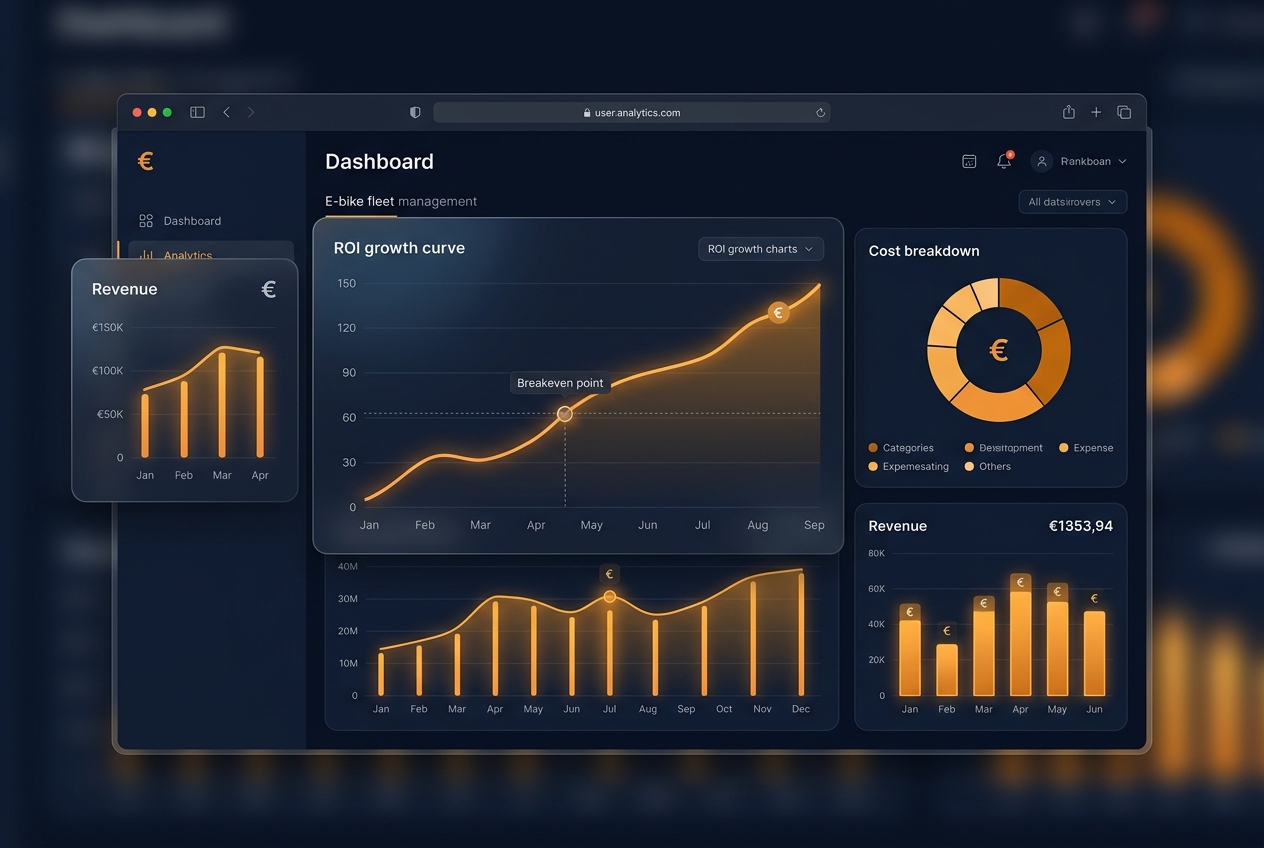
- El punto de equilibrio se alcanza con solo ~0,2 alquileres por bici y día (6 alquileres al mes por bici) a un ticket medio de 14 €.
- En el escenario base (0,8 alquileres/bici/día), el payback del CAPEX es de ~5 meses; en temporada alta baja a ~2,5 meses.
- El software es el coste más pequeño de la estructura: la licencia de Fleet OS (300 € + 8 €/vehículo) representa ~13 % de los costes totales.
- La palanca de rentabilidad no es recortar costes: es subir la utilización por bici con menos fricción de alquiler.
Respuesta directa: operar una flota de 50 e-bikes compartidas cuesta ≈4.200 €/mes todo incluido. Con un ticket medio de 14 € por alquiler, el punto de equilibrio se alcanza con solo 0,2 alquileres por bici y día, y el payback del CAPEX (75.000 €) llega en ~5 meses en el escenario base. El software de gestión de flotas es la partida más pequeña del presupuesto — y la que más costes operativos elimina.
Desglose de costes mensuales: flota de 50 e-bikes
Simulación orientativa para una operación de rental turístico/hotelero en España (e-bikes de 1.500 € amortizadas a 36 meses):
| Concepto | Coste mensual | % del total |
|---|---|---|
| Licencia SaaS Fleet OS (300 € + 50 × 8 €) | 700 € | 13 % |
| Amortización de flota (50 × 1.500 € / 36 meses) | 2.083 € | 50 % |
| Mantenimiento y recambios (≈12 €/bici) | 600 € | 14 % |
| Operación de campo (carga nocturna, reubicaciones) | 700 € | 17 % |
| Seguro de responsabilidad civil | 250 € | 6 % |
| Total costes | ≈4.183 € | 100 % |
Dos lecturas importantes:
- La mitad del coste es amortización, no caja: si financias o alquilas la flota, tu necesidad de circulante mensual real es de ~2.100 €.
- El software es el 13 % — y sin él, las partidas de operación y gestión se disparan (cobros manuales, Excel, personal de mostrador).
Ingresos y punto de equilibrio
Con un ticket medio de 14 € por alquiler (medio día / día completo en turismo):
- Ingreso por bici y mes = 14 € × alquileres/día × 30.
- Punto de equilibrio de la operación: 4.183 € ÷ (14 € × 30 × 50 bicis) = 0,2 alquileres por bici y día. Es decir: con que cada bici salga 6 veces al mes, ya no pierdes dinero.
Todo lo que supere ese umbral cae casi íntegro al beneficio, porque los costes son fijos en un 90 %.
Tres escenarios de payback del CAPEX
CAPEX inicial: 50 e-bikes × 1.500 € = 75.000 €. Beneficio operativo = ingresos − costes de caja (≈2.100 €/mes sin amortización):
| Escenario | Alquileres/bici/día | Ingresos/mes | Beneficio operativo | Payback CAPEX |
|---|---|---|---|---|
| Conservador | 0,4 | 8.400 € | ≈6.300 € | ~12 meses |
| Base | 0,8 | 16.800 € | ≈14.700 € | ~5 meses |
| Temporada alta | 1,5 | 31.500 € | ≈29.400 € | ~2,5 meses |
Incluso el escenario conservador amortiza la flota en un año, con 24 meses restantes de vida útil generando margen.
La palanca real del ROI: utilización, no costes
El error clásico de los decisores financieros es atacar los costes (ya optimizados) en lugar de la utilización. Pasar de 0,4 a 0,8 alquileres/bici/día duplica ingresos sin añadir un euro de coste fijo. Las tres palancas probadas:
- Eliminar fricción de alquiler: una WebApp sin descargas convierte hasta un 30 % más que un proceso manual o con app obligatoria (cómo funciona en hoteles).
- Cobros automáticos: horas extra e impagos cobrados solos vía Stripe suman 5-8 % de ingresos que antes se perdían.
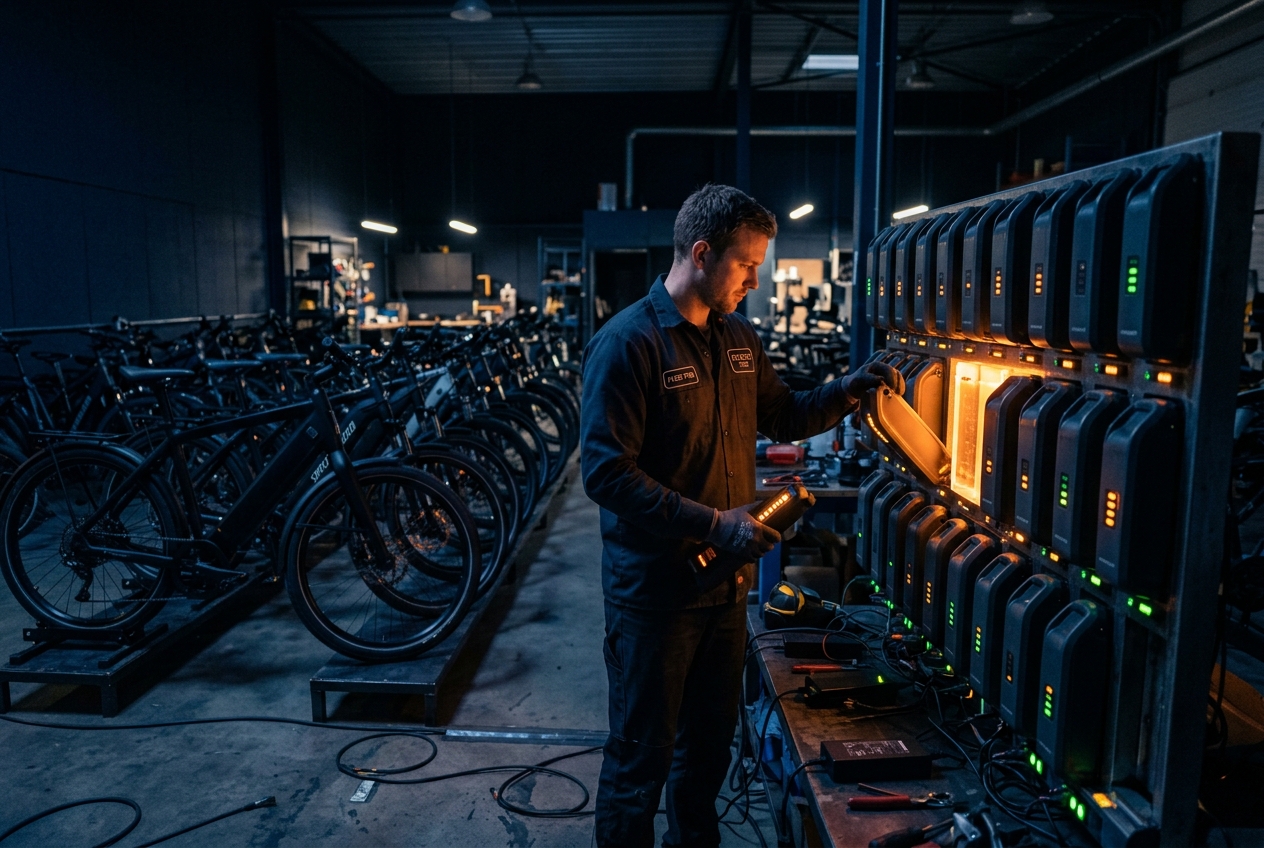
- Flota siempre disponible: las alertas nocturnas de batería mantienen >92 % de la flota operativa sin ampliar plantilla.
Cómo validar estos números con tu caso
Cada operación tiene su ticket, su estacionalidad y su coste de campo. La forma más rápida de aterrizar el business case es usar la calculadora interactiva de Fleet OS con tu número real de vehículos y contrastar los tres escenarios de utilización con datos de tu zona. Si vienes de comparar plataformas, aquí tienes la comparativa de software de gestión de flotas 2026.
Preguntas frecuentes
¿Cuál es el margen de beneficio típico de una flota de e-bikes compartidas?
En operaciones bien gestionadas (rental turístico u hotelero), el margen operativo suele situarse entre el 55 % y el 75 % de los ingresos una vez superado el punto de equilibrio, porque los costes son mayoritariamente fijos: cada alquiler adicional cae casi íntegro al beneficio.
¿Cuánto se tarda en amortizar una flota de bicis eléctricas?
Con e-bikes de ~1.500 € y una utilización media de 0,8 alquileres por bici y día a 14 € de ticket, el CAPEX se recupera en unos 5 meses. En escenarios conservadores (0,4 alquileres/día) el payback ronda los 12 meses, todavía muy por debajo de la vida útil de 36 meses del vehículo.
¿Cuánto cuesta el software respecto al total de la operación?
Con Fleet OS, una flota de 50 vehículos paga 700 €/mes (300 € base + 50 × 8 €), aproximadamente el 13 % de los costes totales. Es la partida más pequeña del P&L y la que más costes elimina: cobros automáticos, alertas de carga y cero gestión manual de reservas.
¿Qué utilización por bici es realista?
Referencias del sector en España: 0,3–0,6 alquileres/bici/día en operaciones urbanas todo el año, 0,8–1,5 en destinos turísticos en temporada y hasta 2+ en hoteles resort con flota ajustada a la demanda.
FLEET OS
Calcula el ROI de tu flota con una demo personalizada
Usa la calculadora interactiva de Fleet OS para estimar tu cuota mensual y pide una demo con los números reales de tu operación. Respuesta en menos de 24 horas laborables.
Calcular mi ROI con Fleet OS